Looker explores
Overview
The Explores tab provides a dashboard design interface for users with a Design license.
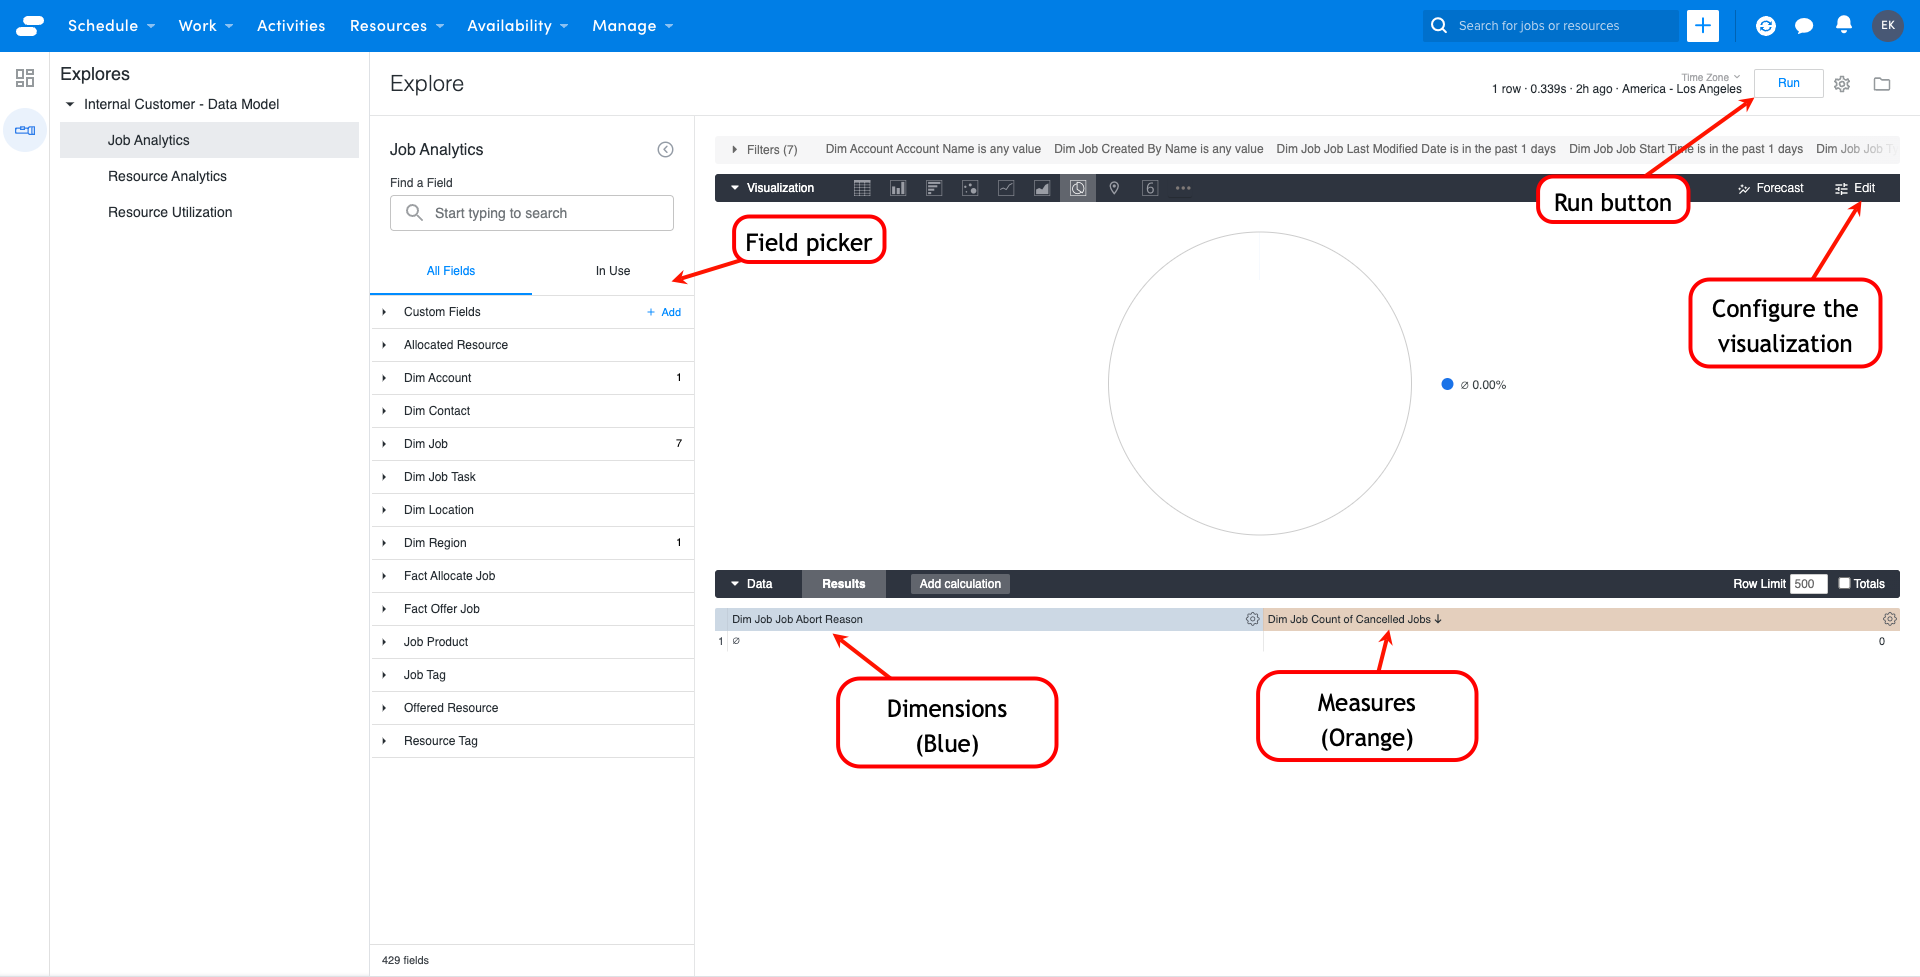
Before creating your own dashboards, you should get to know the main concepts:
- Dimensions: These are columns of your data, which could be physical (exist as columns in the database) or logical (eg., calculation or translation of the actual data).
- Measures: Aggregations and calculations across one or many rows, such as sum, min, max, average, etc.
- Visualization: A representation of the aggregated data using color and shape to make it easier to interpret trends.
- Filters: Limits for your data to customize your view.
- Pivots: A way of turning a dimension into multiple columns, to explore across multiple groups.
By picking fields to use as the dimensions and measures, you can build visualizations for any use case. They can then be saved as a Look, a dashboard, or as a tile on an existing dashboard.
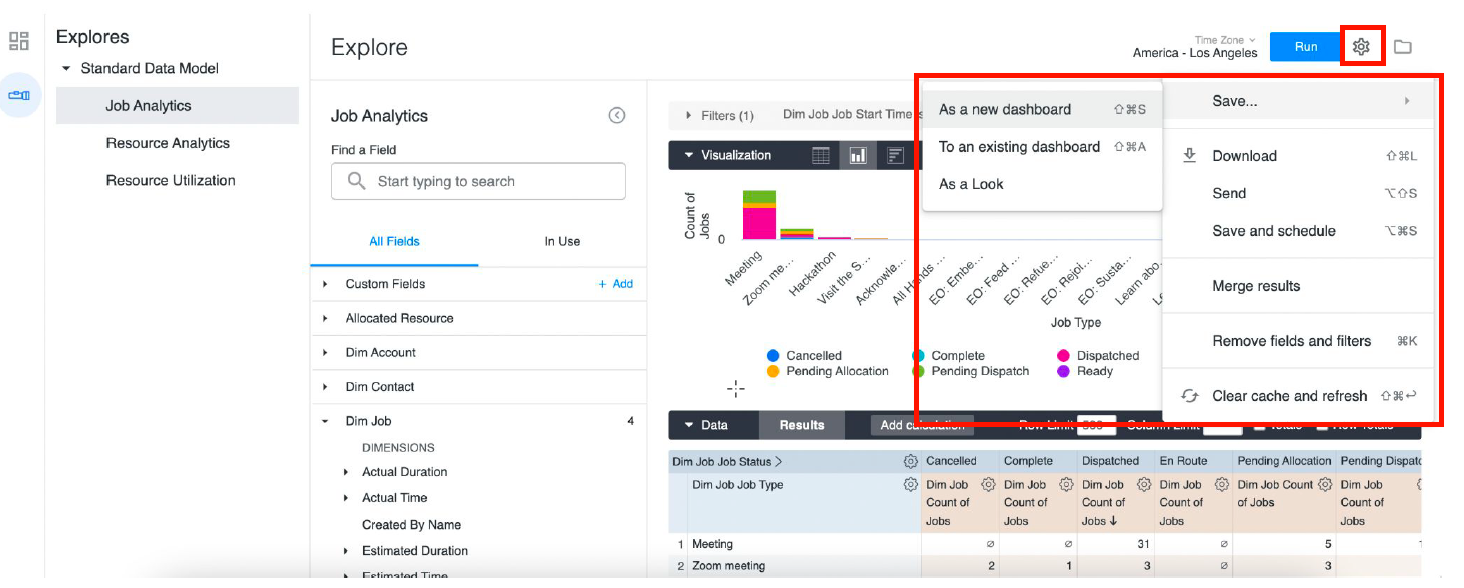
Details on how to create dashboards can be found in the Looker documentation.
Feedback
Was this page helpful?