Skedulo CLI Studio
Overview
Skedulo CLI Studio is the Skedulo CLI’s full-screen, keyboard-driven terminal UI. It brings together tenant management, an artifact browser, a log viewer, an HTTP client, and a command browser in one interactive session.
Launch it with:
sked
You can also invoke it using sked interactive:
sked interactive
Note
Requires CLI version 5.1.2 or later.Important
Skedulo CLI Studio needs a real terminal (TTY) on both input and output. It does not launch when the CLI’s output is piped or redirected to a file.Welcome
The first time you launch Skedulo CLI Studio with no stored tenant, it shows a welcome screen. From there you can:
- Press Enter to log in to a tenant, using the same guided flow as
sked tenant login. - Press
dto open the CLI’s quickstart documentation in your browser. - Press
qto quit.
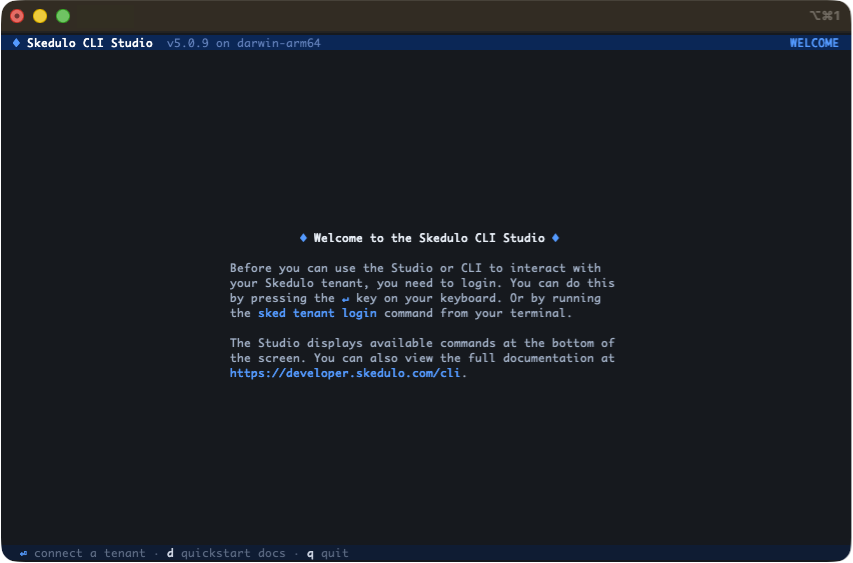
Once you have at least one stored tenant, Studio opens straight to the menu instead.
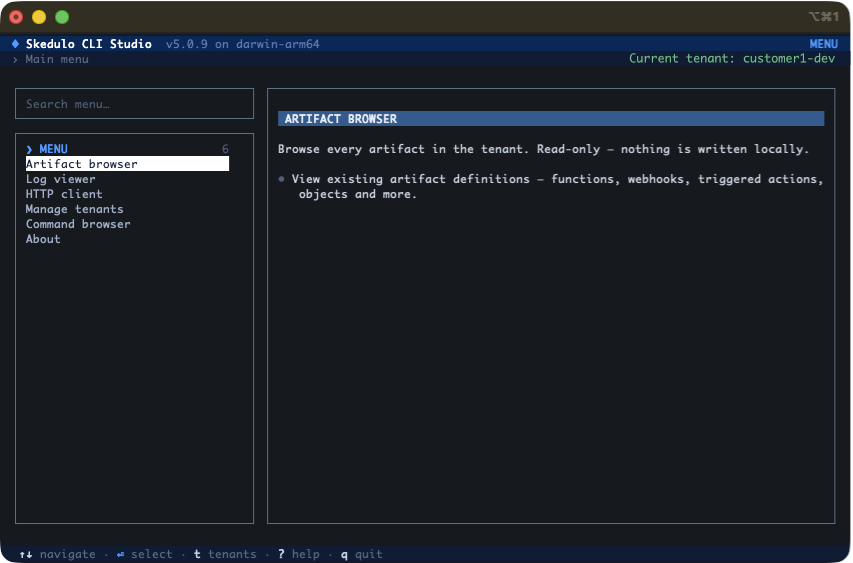
The menu
The menu lists each screen described below, and search narrows the list as you type. There is also an “About” screen that shows the CLI version and platform details.
Screens
Manage tenants
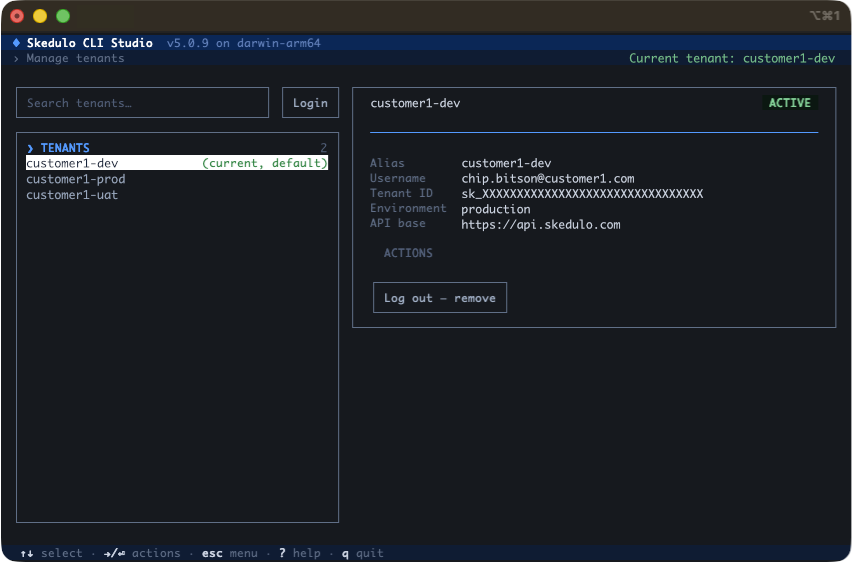
The Tenants screen lists every stored tenant, with a search box to filter them. Selecting a tenant shows its alias, username, tenant ID, environment, API base path, and whether its token has expired.
From here you can set a tenant as current, set it as your default, or log out of it. A separate “Login” action starts the same guided login flow as the welcome screen. You can also switch tenants from most other screens by pressing t.
For the underlying commands, see the sked tenant command reference.
Browse artifacts
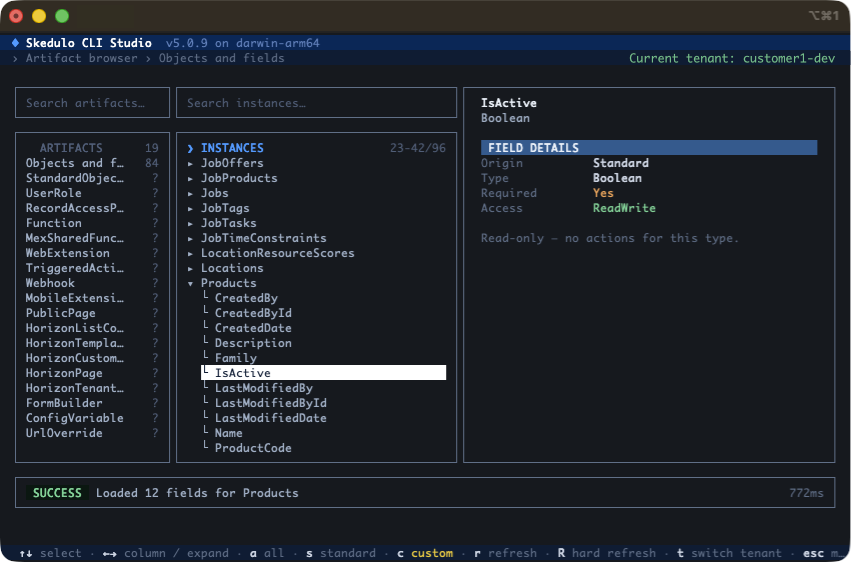
The artifact browser is a three-column screen: artifact and object types on the left, instances of the selected type in the middle, and full field detail for the selected instance on the right.
The middle column supports search. For object types, it also has a filter to show all fields, standard fields only, or custom fields only. The detail column separates a record’s own fields from its system fields (ID, created, updated). For object fields, it also shows schema detail: origin, type, whether a field is required, access mode, and picklist values.
Depending on the selected row, an actions list can offer “View logs” (for webhooks, triggered actions, and functions) or “Test endpoint” (for functions, which opens the HTTP client pre-filled with that function’s URL).
Press r to refresh the current column, or R to refresh every column and clear the cache.
For more on artifacts, see Work with artifacts.
View logs
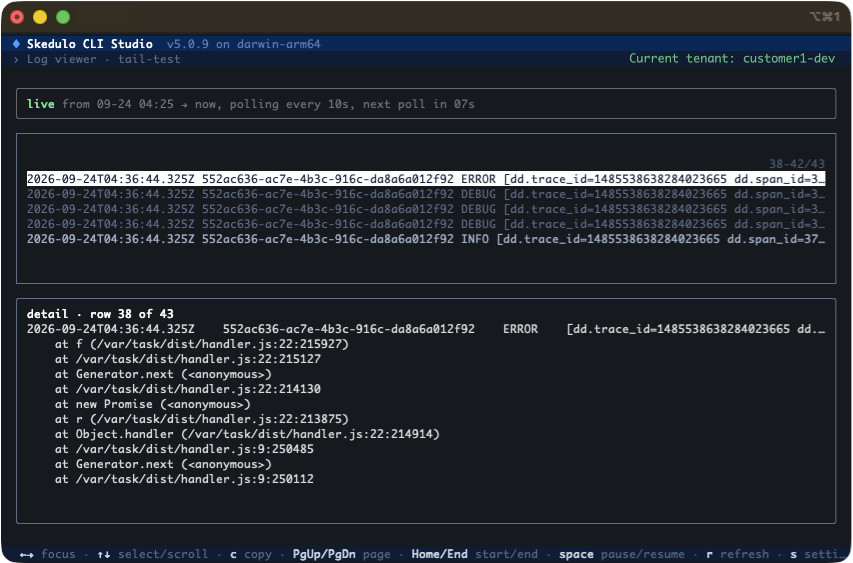
The log viewer shows execution log entries for a triggered action, webhook, or function: a scrollable list of entries on one side, and full detail for the selected entry on the other. A status line shows whether the session is live, paused, or historic, along with the current poll interval.
A live session stops polling automatically 60 minutes after it started, or after it was last reset. It shows a prompt rather than exiting outright. Press r to resume, or start a fresh session. Pressing space to pause or resume, or applying new settings to a live session, resets the timer. Leaving the screen open does not.
Press space to pause or resume a live session, s to open the settings panel (switch between live and historic mode, change the poll interval, and set the from/to time window), and c to copy the selected entry’s full detail to your clipboard.
The same log viewer opens when you run sked logs tail outside Studio. For the full command reference, see sked logs.
HTTP client
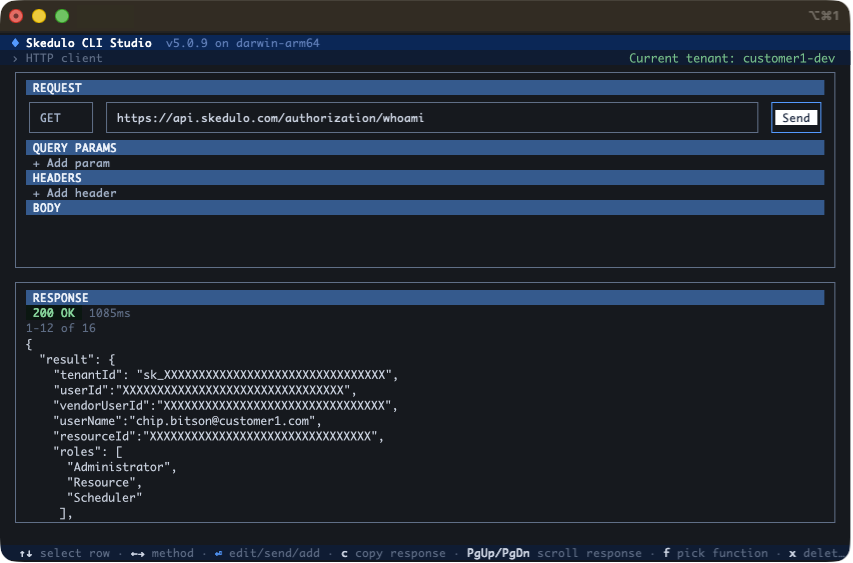
The HTTP client screen builds and sends an ad-hoc request to the Skedulo API: a method and URL field, editable query parameters and headers, and a body field, with the response shown below, including its status, duration, and body.
Use the arrow keys to move the cursor within the URL field, the body field, and the query-parameter and header fields. Press c to copy the response body to your clipboard.
The same screen opens when you run sked http with no URL. For the full command reference, see sked http.
Browse commands
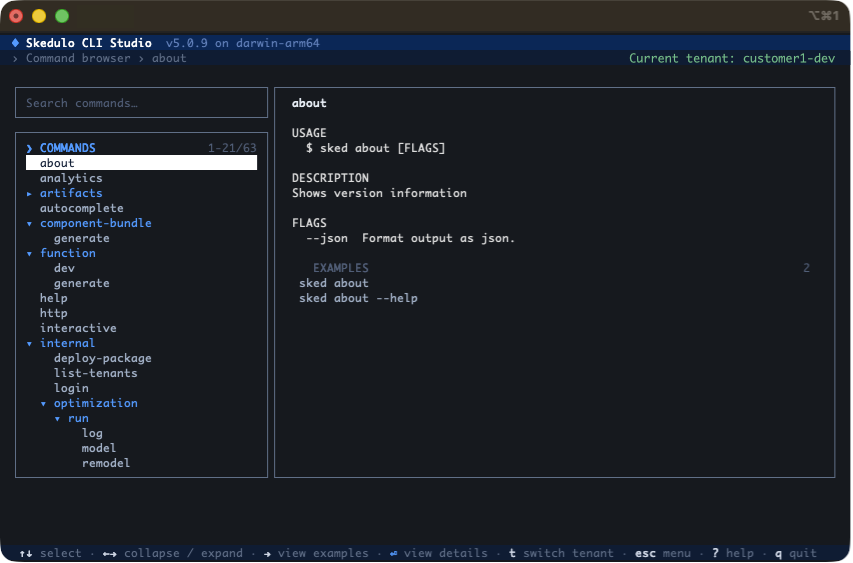
The command browser lists every sked command and topic in a searchable tree. Selecting a command shows its usage, description, arguments, flags, and aliases. A command with examples lists them in their own navigable panel; press c to copy the selected example to your clipboard, ready to run.
Get help
Press ? from any screen to open a help overlay listing that screen’s keybindings.
Next steps
Now that you know your way around Skedulo CLI Studio, check out:
Authenticate with the Skedulo CLI
Feedback
Was this page helpful?